|
SIO Argo Site:
BGC SOLO Sensor Page
|

|
Serial= 0001 WMO= 4903026
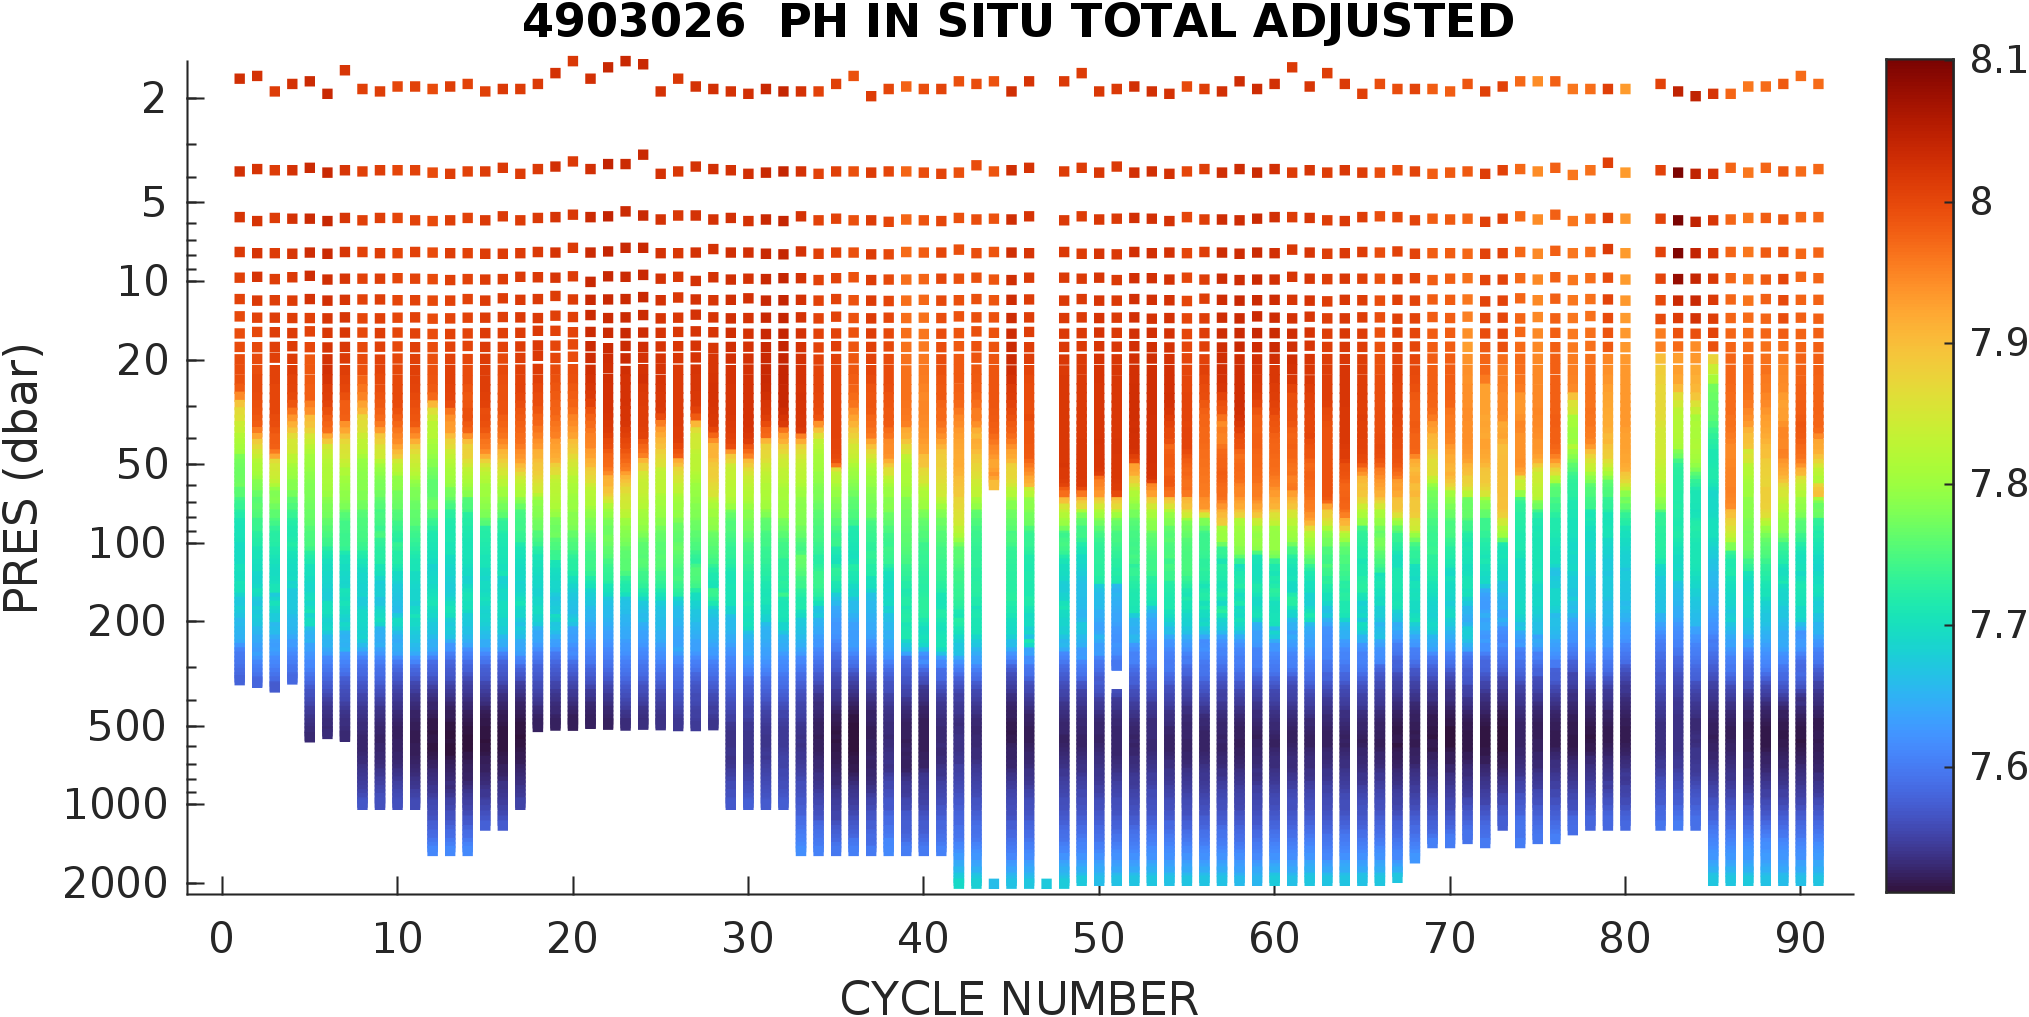
| Display of PH_IN_SITU_TOTAL_ADJUSTED obtained from the Argo GDAC Sprof netCDF file. |
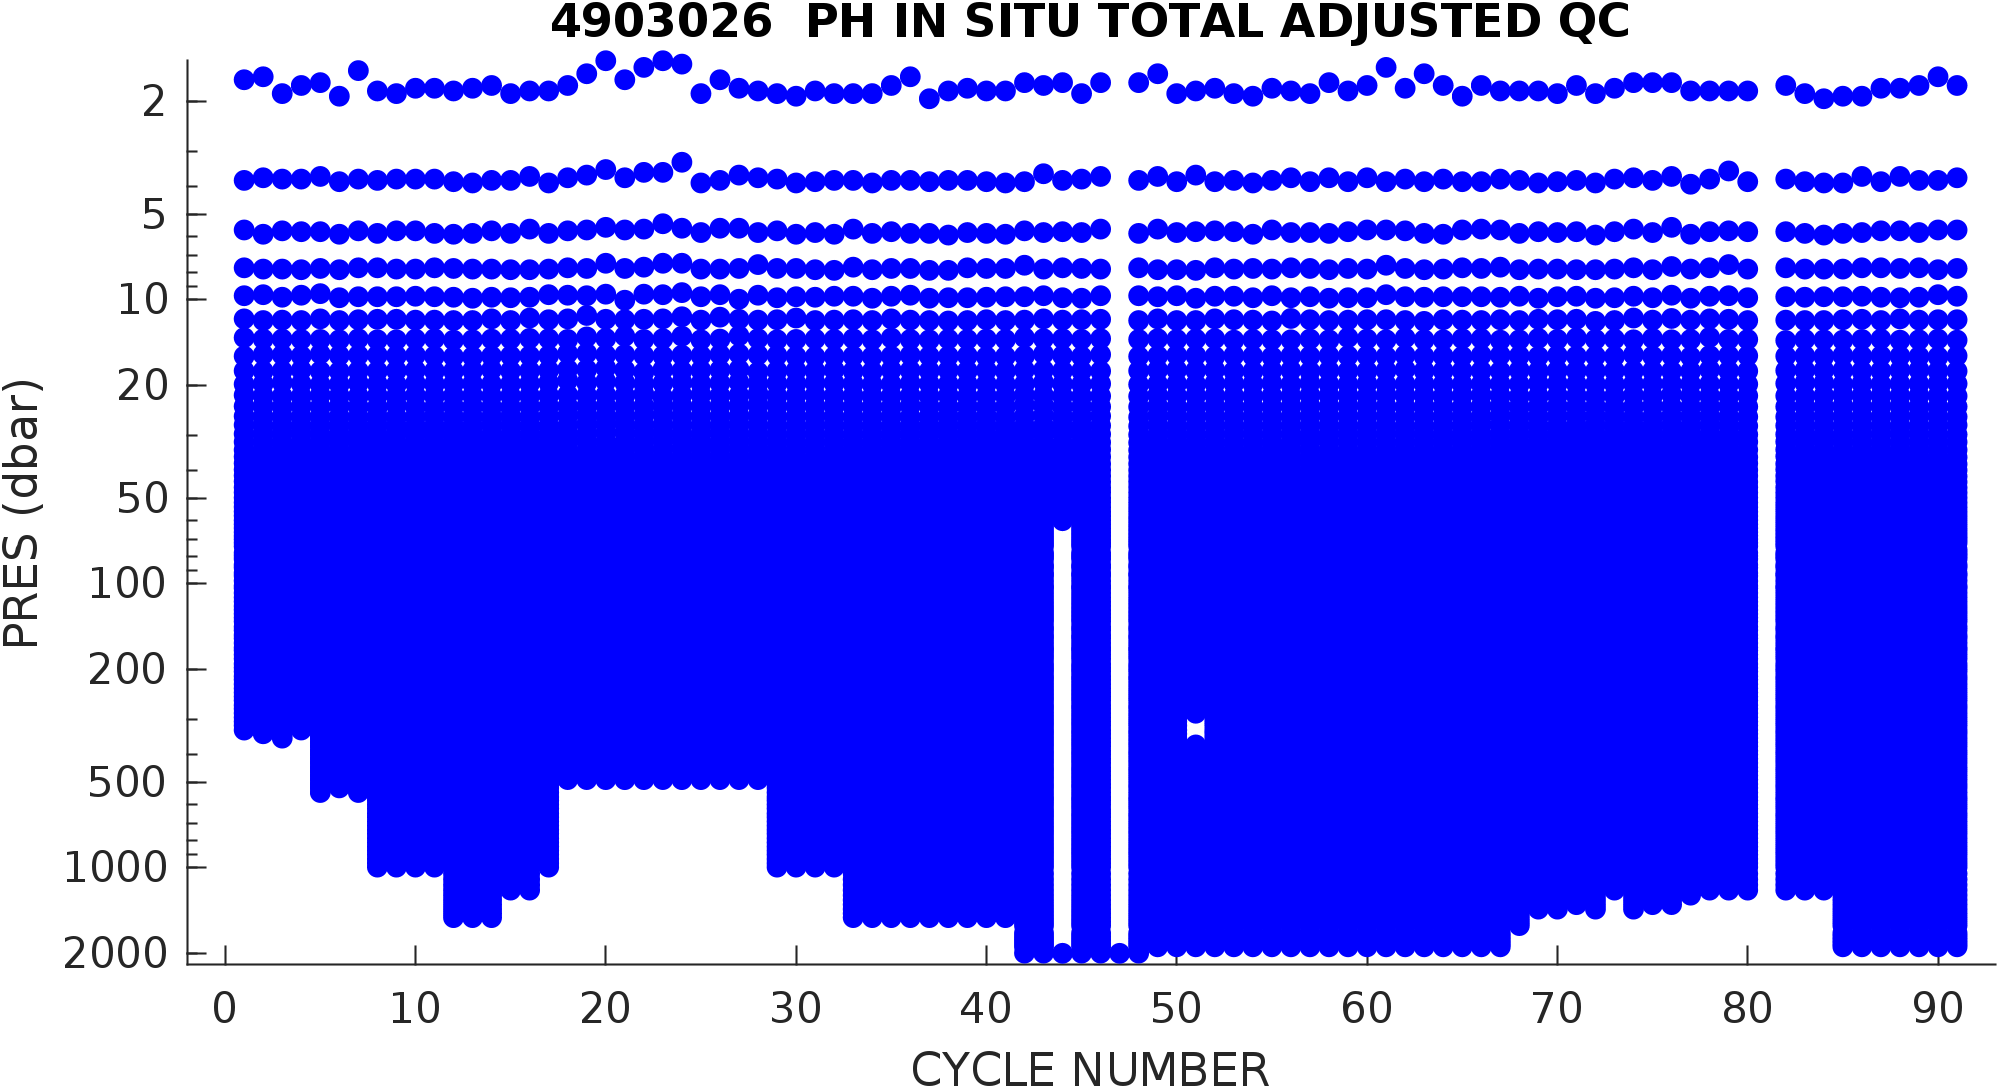
Display of the PH_IN_SITU_TOTAL_ADJUSTED_QC flag obtained from the Argo GDAC Sprof netCDF file.
(blue: "good" QC=1; green: "probably good" QC=2; yellow: "probably bad" QC=3; red: "bad" QC=4;)
Bad flags, "3" and "4" are plotted last to accentuate the location of bad data. |
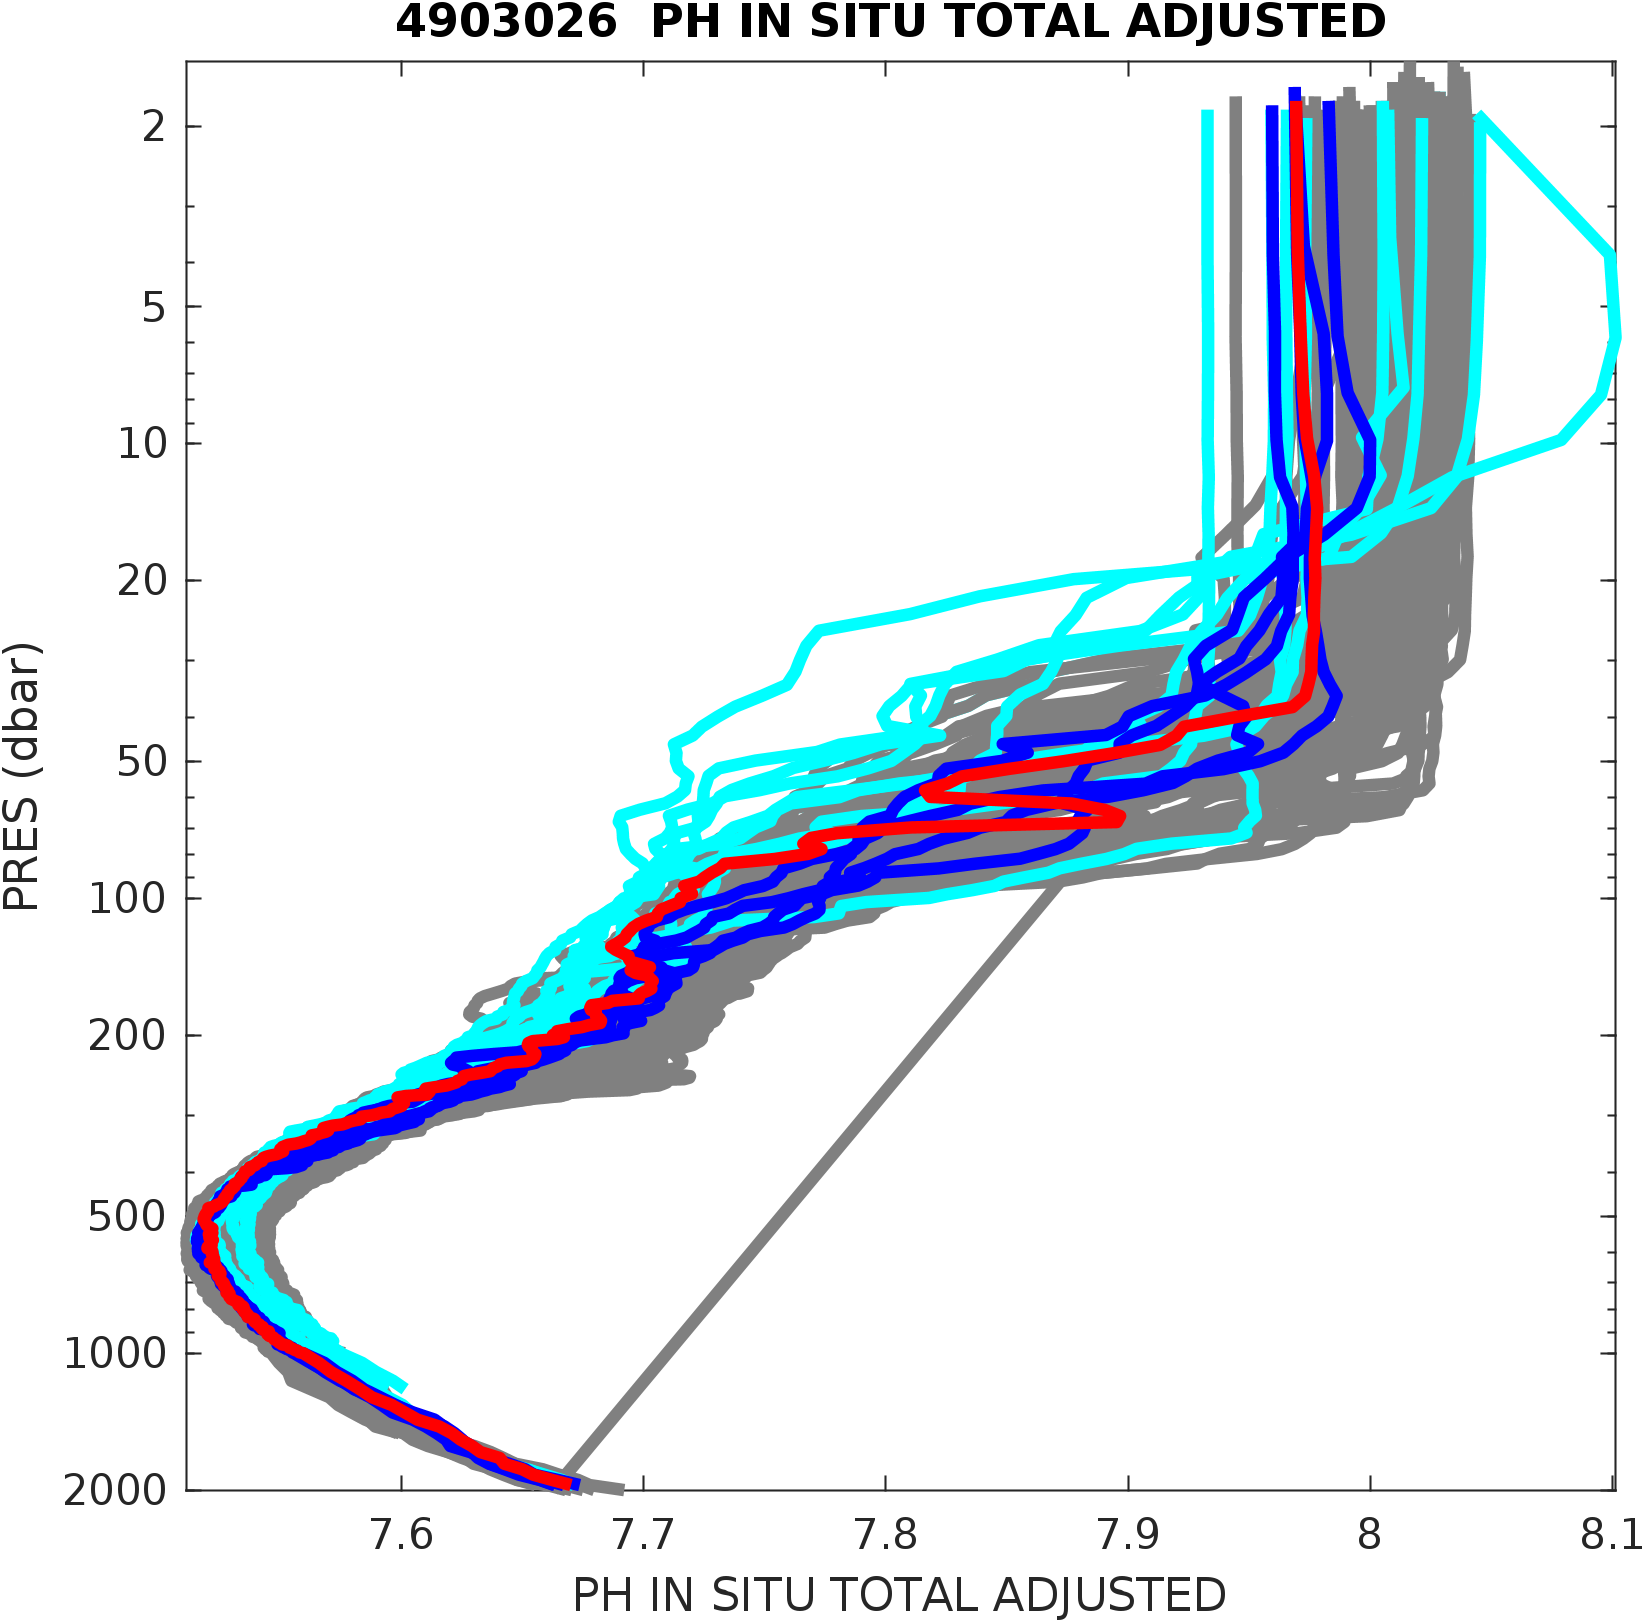
Display of overlayed PH_IN_SITU_TOTAL_ADJUSTED obtained from the Argo GDAC Sprof netCDF file.
No data with QC of "3" or "4" are shown.
(grey: past cycles, cyan: last 15 cycles, blue: last 5 cycles, red: latest cycle) |
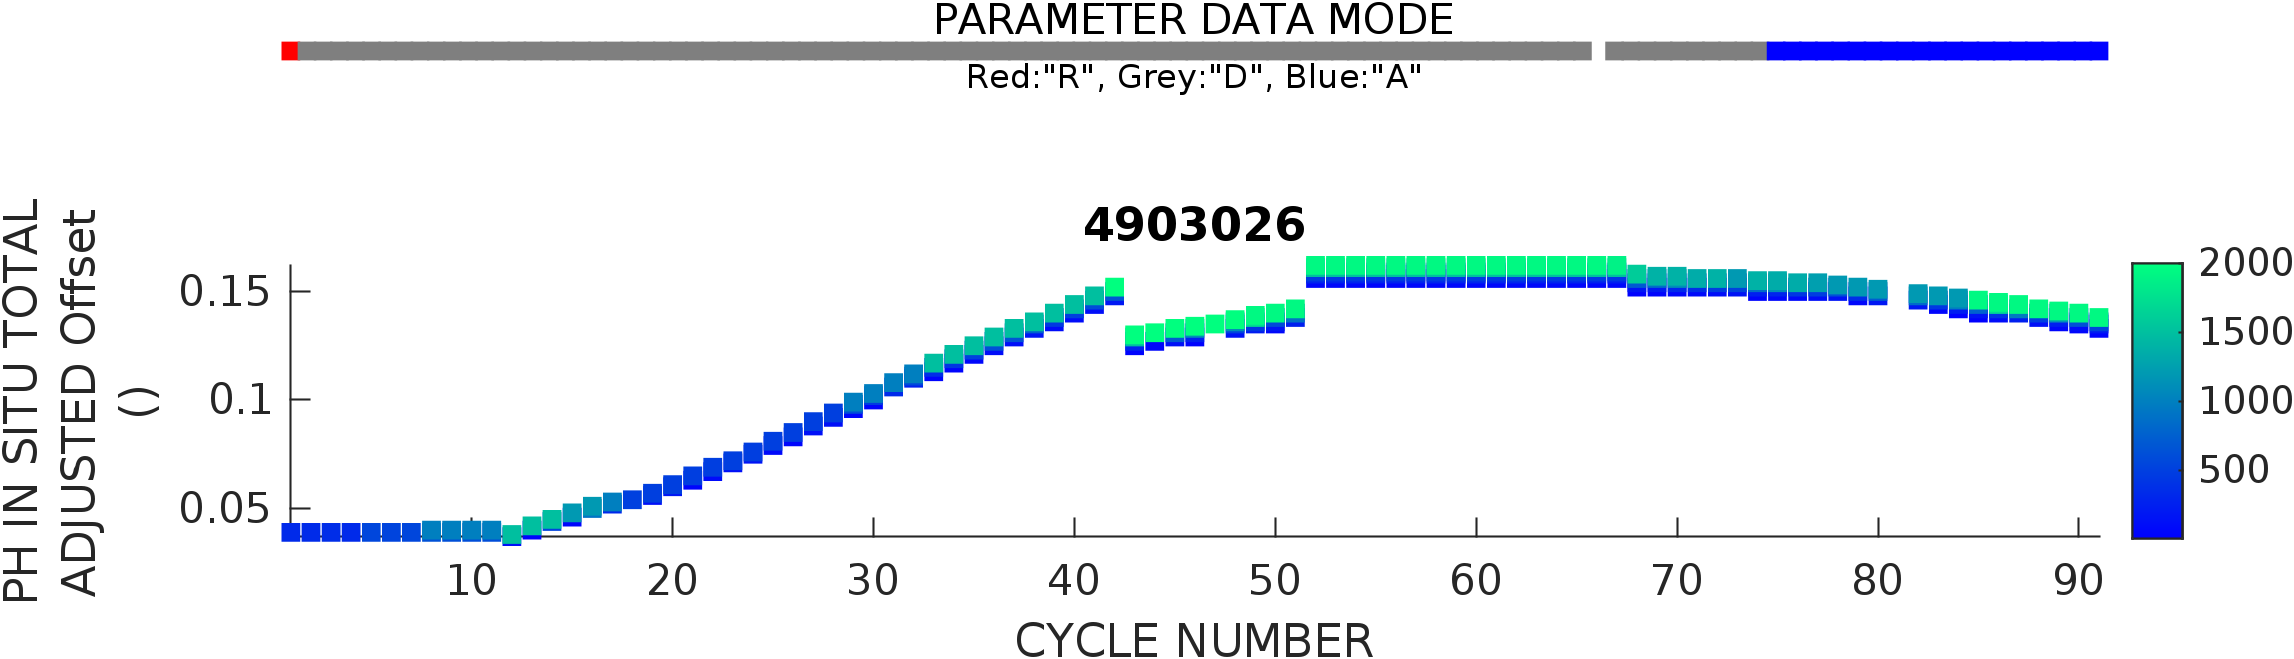
Display of the applied DM adjustment to PH_IN_SITU_TOTAL obtained from the Argo GDAC Sprof netCDF file.
PH_IN_SITU_TOTAL DM adjusment is an offset.
The colorbar is the pressure of the PH_IN_SITU_TOTAL data.
If all pressures have the same gain applied, the greatest pressure color will be visible.
Data flagged as bad are shown with a red square.
|