
|
|
SIO Argo Site:
|
|

|
|
Drift Phase Data
|
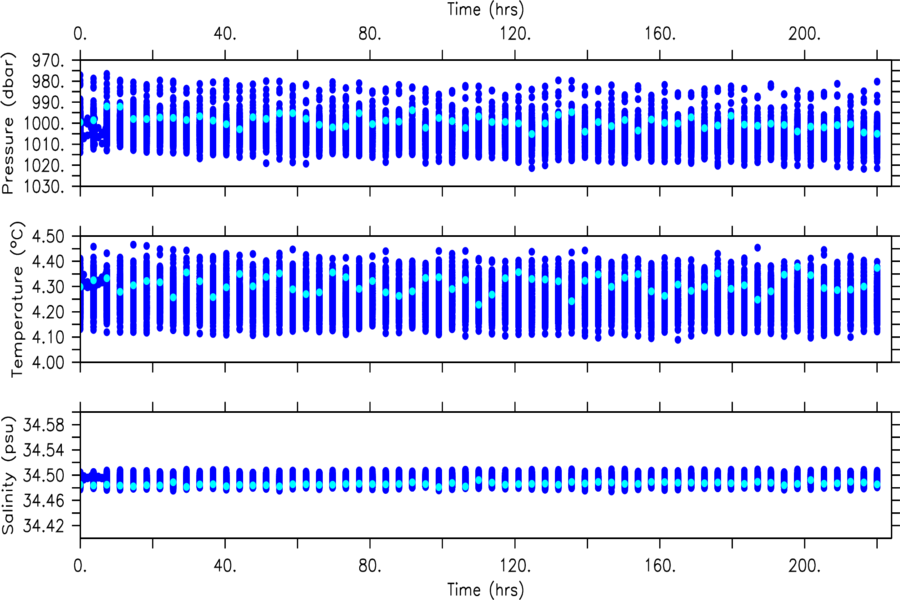
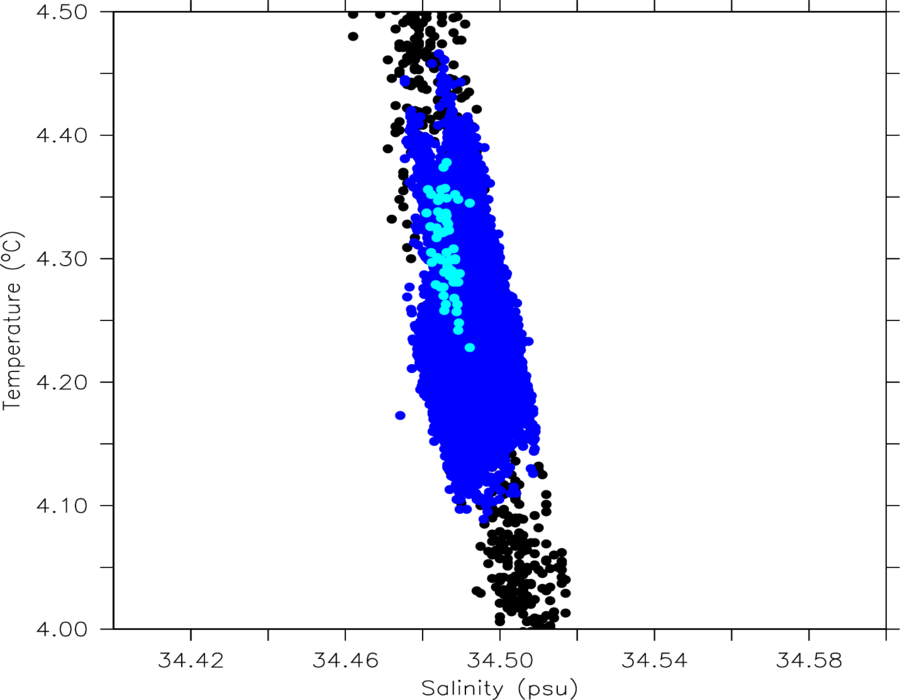
| SOLOII can return spot sampled pressure, temperature and
salinity data during the floats drift phase. The most recent cycle is shown in cyan. In the upper panels, the temporal x-axis is relative to the start of drift of each cycle. If present, red dots indicate bad data determined in DMQC and magenta dots are suspect real time data. In the lower panel, black dots are subsampled profile data. |
|
|