|
Percentage Success of Argo float Iridium cycle data transmission between SIO and AOML
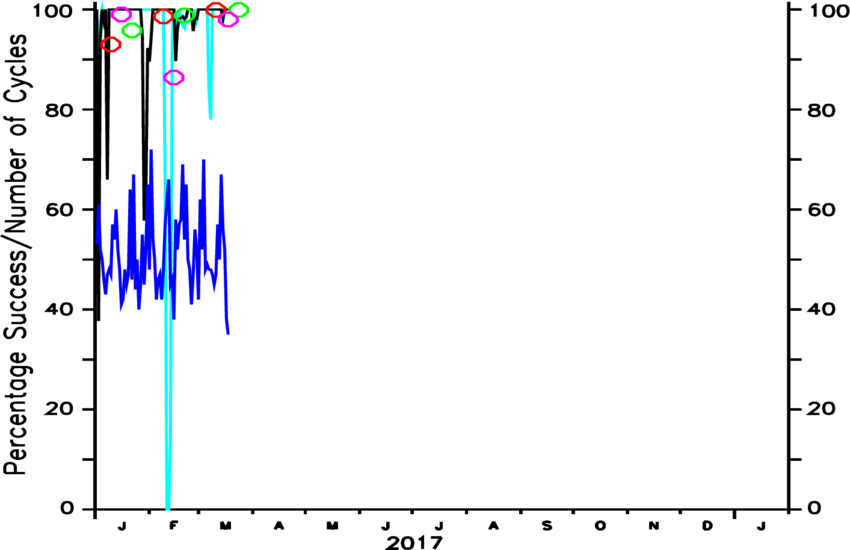
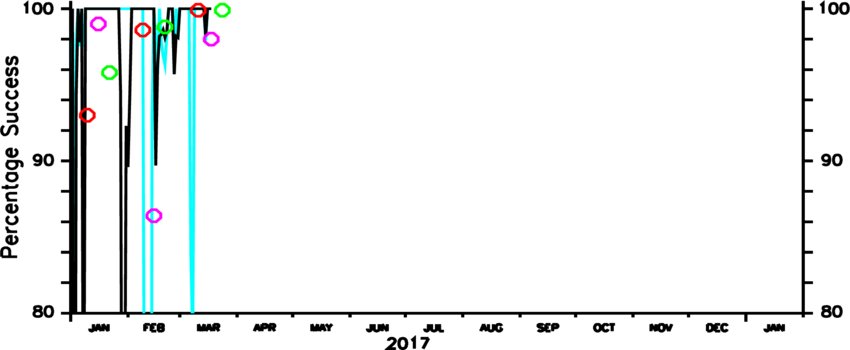
SIO decodes the Iridium data transmitted by our floats. This data is then communicated to AOML, who passes the data onward to the GDAC and GTS. Argo strives to make float data available within 24 hours of transmission. The below figure tracks SIOs success in aiding this goal. This figure is updated daily.
Percentage Success is defined as the percentage of Argo float cycle data that is transmitted to AOML within 5 hrs. This measure was chosen to leave more than sufficent time for the data to reach the GDAC/GTS within 24 hrs.
Horizontal Axis: Time
Veritcal Axis: Percentage Success and Number of Cycles. Both share the same axis scale.
Black Line: Percentage Success determined daily.
Red Circle: Percentage Success averaged over the given month
Green Circle: Percentage of Argo float cycles that were successfully transmitted to AOML within 12 hours, averaged over the given month. This measure is more lenient then Percentage Success, but still provides sufficient time for the data to reach the GDAC/GTS within 24 hrs.
Cyan Line: Percentage of SIO Argo float cycles ('R' files) that were submitted to the GDAC by AOML within 24 hours, averaged daily.
Magenta Circle: Percentage of SIO Argo float cycles ('R' files) that were submitted to the GDAC by AOML within 24 hours, averaged over the given month.
Blue Line: Number of daily Argo float Iridium cycles collected and processed by SIO, followed by transmission to AOML.
Red Dashes (top of plot): Days on which an AOML ftp server outage occurred which affected SIO file transmission. On these days the most likely cause of reduced Percentage Success is due to the unavailability of the AOML ftp server.
Note that the number of cycles in the AOML daily/monthly percentage can be reduced due to the exchange of the 'R' for 'D' profile netCDF files at the GDAC. The AOML percentage is based on this reduced number.
|