
|
|
SIO Private Argo Site |

|
| IDG | MRV | ||||||
|---|---|---|---|---|---|---|---|
| Temporal Range & Float Grouping (Firmware or Characteristic) |
Percent Success (in first 5 years) |
Effective Lifetime (years) |
# Fully Operational (Float+CTD) |
Percent Success (in first 5 years) |
Effective Lifetime (years) |
# Alive | |
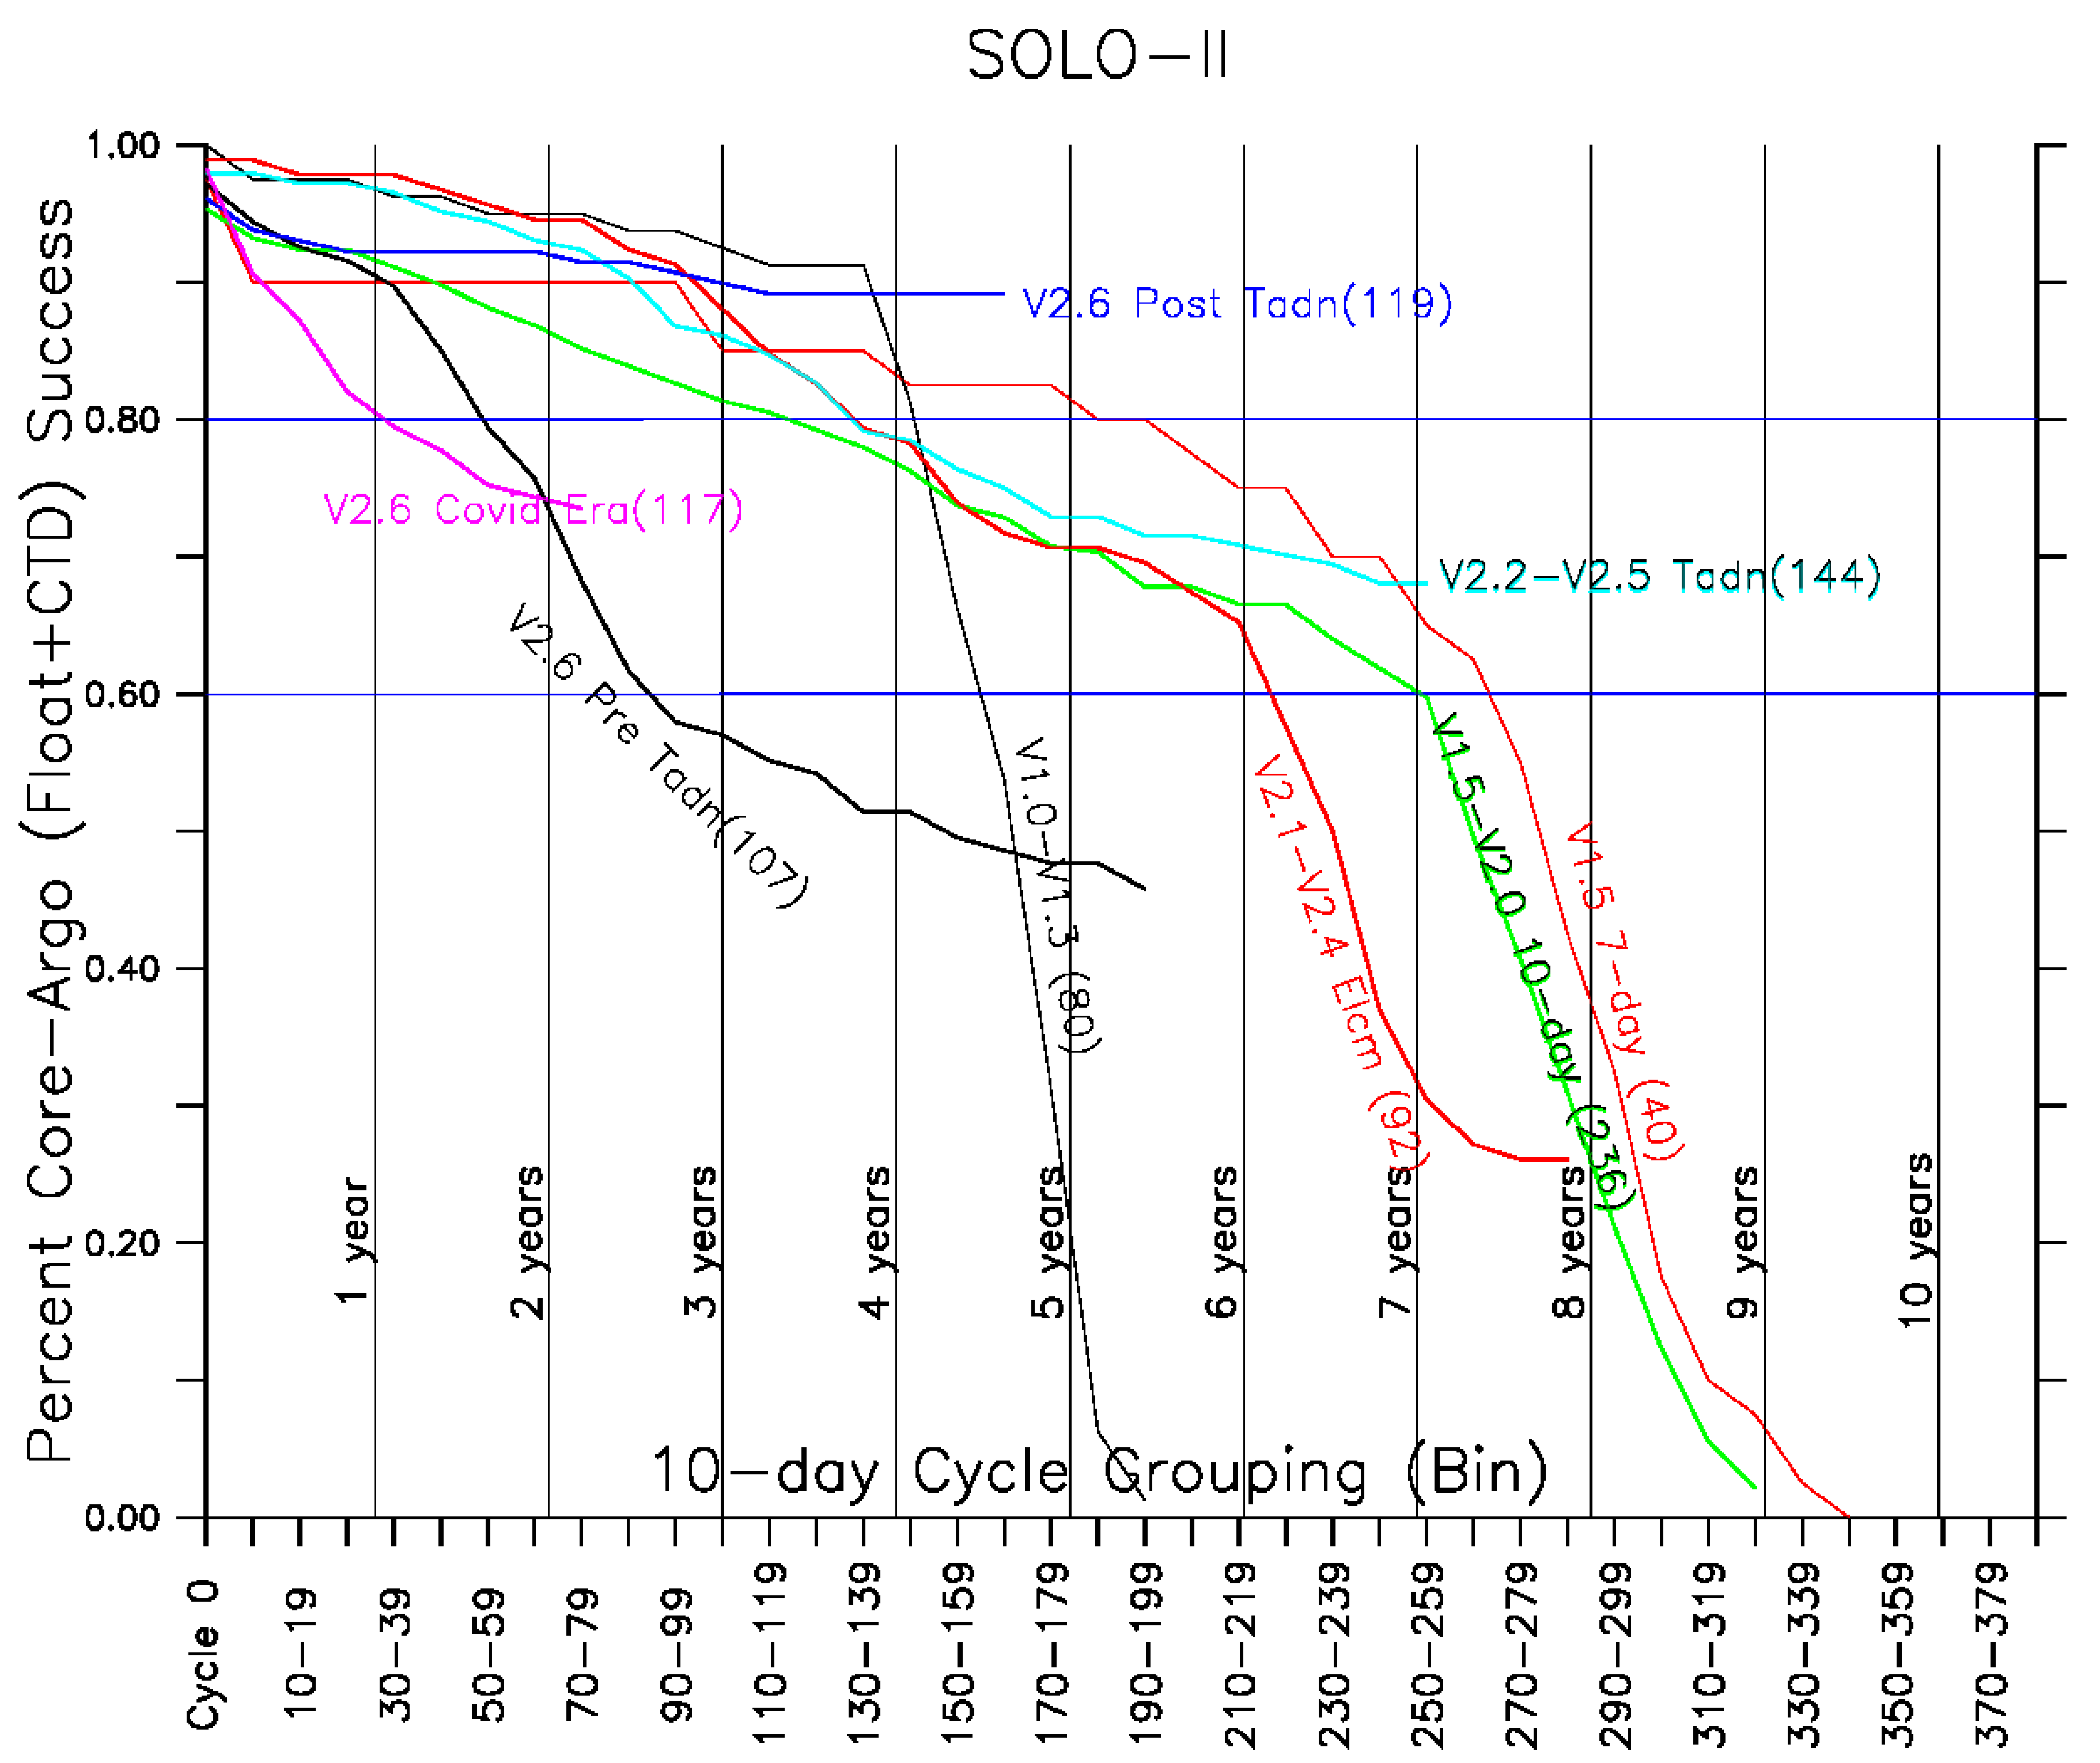
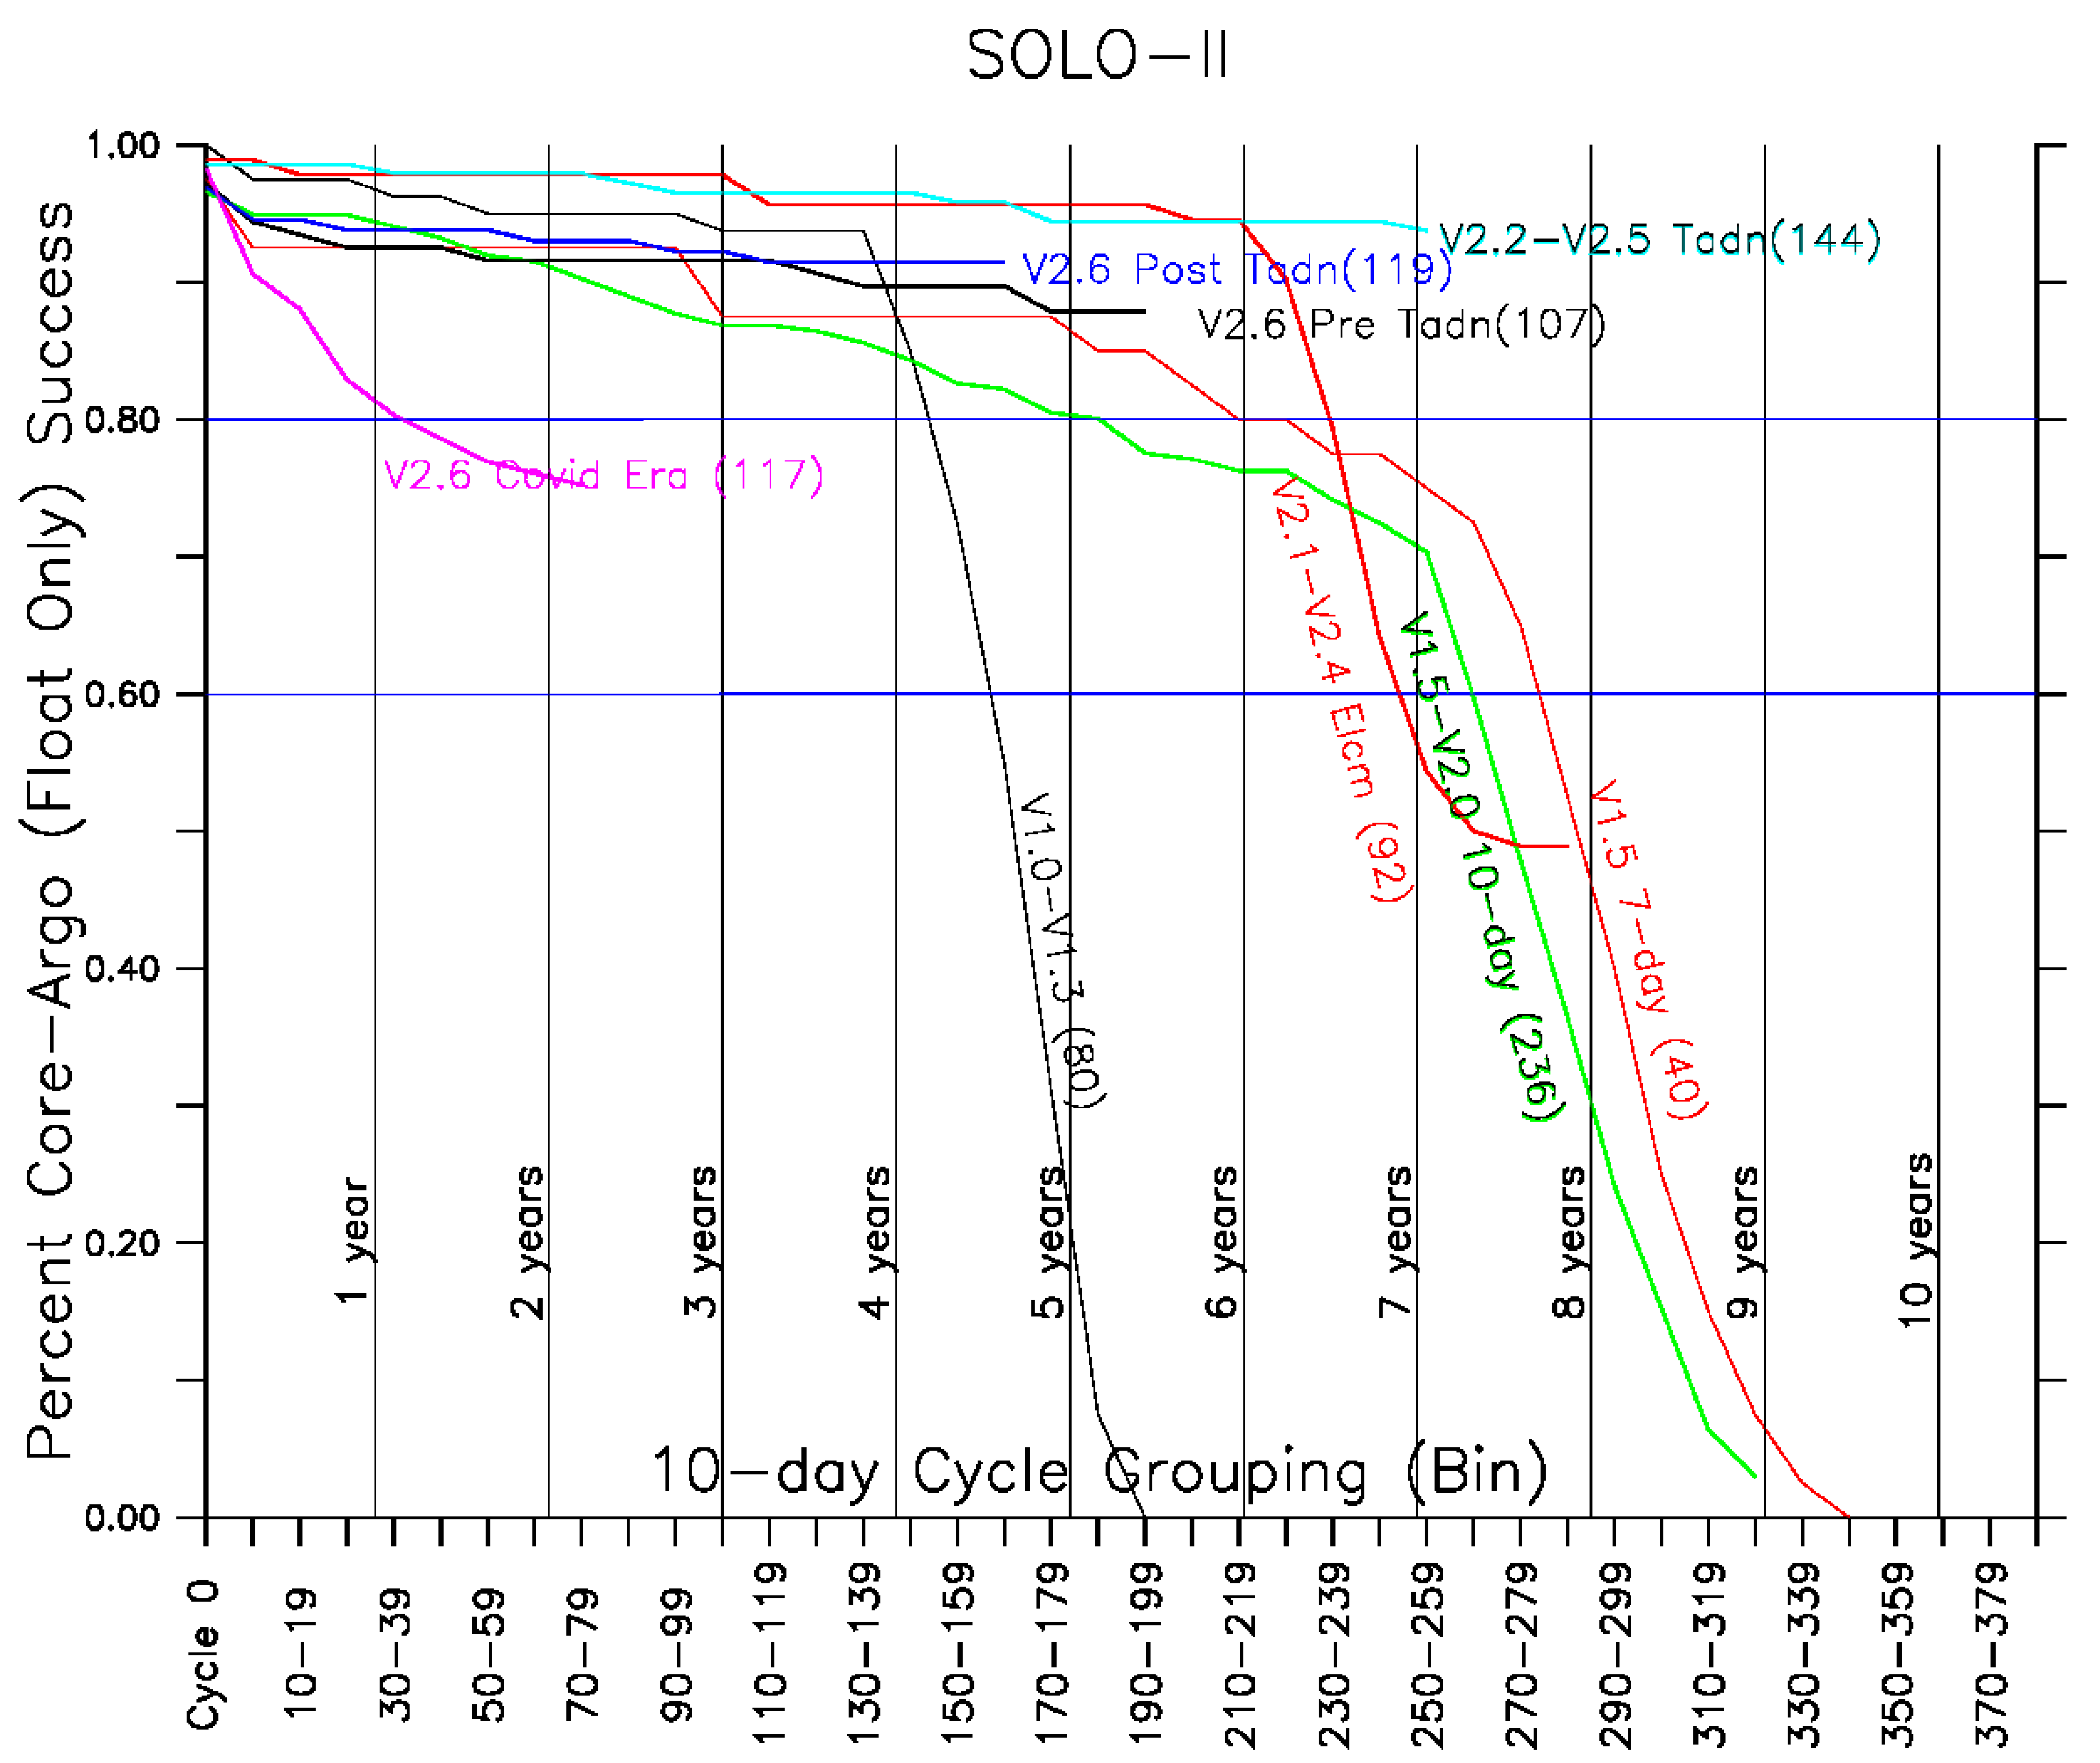
| Sep 2021 - Jan 2023 V2.6 Tadiran "Covid" Era |
Float+CTD=80.5 Float=81.3 | Float+CTD=1.36 Float=1.38 | 86/117 | - | - | - | |
| Dec 2019 - Jul 2021 V2.6 Tadiran Post CTD Mfg Mod |
Float+CTD=91.7 Float=93.2 | Float+CTD=3.14 Float=3.20 | 115/129 | - | - | - | |
| Aug 2018 - Jan 2020 V2.6 Tadiran Pre CTD Mfg Mod |
Float+CTD=67.9 Float=91.1 | Float+CTD=3.34 Float=4.51 | 49/107 | - | - | - | |
| Oct 2016 - Sep 2018 V2.2-V2.5 Tadiran |
Float+CTD=88.3 Float=97.2 (Final) | Float+CTD=5.27 Float=6.00 | 98/144 | - | - | - | |
| Sep 2015 - Aug 2017 V2.1-V2.4 ElectroChem |
Float+CTD=88.9 Float=97.1 (Final) | Float+CTD=5.74 Float=6.74 | 24/92 | - | - | - | |
| Jul 2013 - Nov 2015 V1.5 & V2.0 10-day 3 Battery Pack |
Float+CTD=83.6 Float=90.5 (Final) | Float+CTD=6.05 Float=6.79 | 11/236 | - | - | - | |
| Jan 2014 - Mar 2014 V1.5 Sandy Time-Scaled 3 Battery Pack |
Float+CTD=87.4 Float=90.4 (Final) | Float+CTD=6.67 Float=7.10 (Final) | 0/40 | - | - | - | |
| Oct 2012 - Dec 2012 V1.3 2 Battery Pack |
80.7 (Final) | 4.00 (Final) | 0/20 | 69.8 (Final) | 3.45 (Final) | 0/20 | |
| Feb 2012 - Jun 2012 V1.1 & V1.2 2 Battery Pack |
86.8 (Final) | 4.38 (Final) | 0/30 | - | - | - | |
| Aug 2011 - Oct 2011 V1.0 2 Battery Pack |
94.9 (Final) | 4.74 (Final) | 0/30 | 71.0 (Final) | 3.58 (Final) | 0/20 | |
| Feb 2011 - Apr 2011 V1.0: Discovery |
30.3 (Final) | 1.50 (Final) | 0/15 | - | - | - | |
| IDG | ||||
|---|---|---|---|---|
| Deployment Time Range, Float Model, or Ship | Percent Success (in first 5 years) |
Effective Lifetime (years) |
# Fully Operational | |
| V0.5 Iridium SOLO Feb 2013 | 87.7 (Final) | 7.31 (Final) | 0/12 | |
| V0.5 Iridium SOLO Feb 2012 - Nov 2012 | 59.1 (Final) | 4.36 (Final) | 0/16 | |
| Format 19 Argos SOLO Feb 2011 - Mar 2012 | 91.4 (Final) | 5.68 (Final) | 0/56 | |
| Format 19 Argos SOLO Nov 2009 - Dec 2010 | 89.9 (Final) | 5.53 (Final) | 0/121 | |
| Format 19 Argos SOLO Oct 2007 - Mar 2009 (Microleak Era) |
74.7 (Final) | 4.40 (Final) | 0/163 | |
| Format 19 Argos SOLO Aug 2006 - Jul 2007 | 83.3 (Final) | 5.42 (Final) | 0/144 | |
| Format 19 Argos SOLO Mar 2005 - Mar 2006 | 84.4 (Final) | 4.34 (Final) | 0/188 | |
| Format 19 Argos SOLO Feb 2004 - Dec 2004 | 76.8 (Final) | 4.05 (Final) | 0/128 | |
| Format 19 Argos SOLO Oct 2002 - Nov 2003 | 54.3 (Final) | 2.78 (Final) | 0/95 | |
| Formats 17&18 Argos SOLO Jun 2000 - Feb 2002 | 25.13 (Final) | 1.25 (Final) | 0/65 | |
|
|
