|
SIO Argo Site:
Delayed Mode
Quality Control Tabulation Page
|

|
Serial= 8621 WMO= 5905260
|
Currently Assigned Quality Control Flags
|
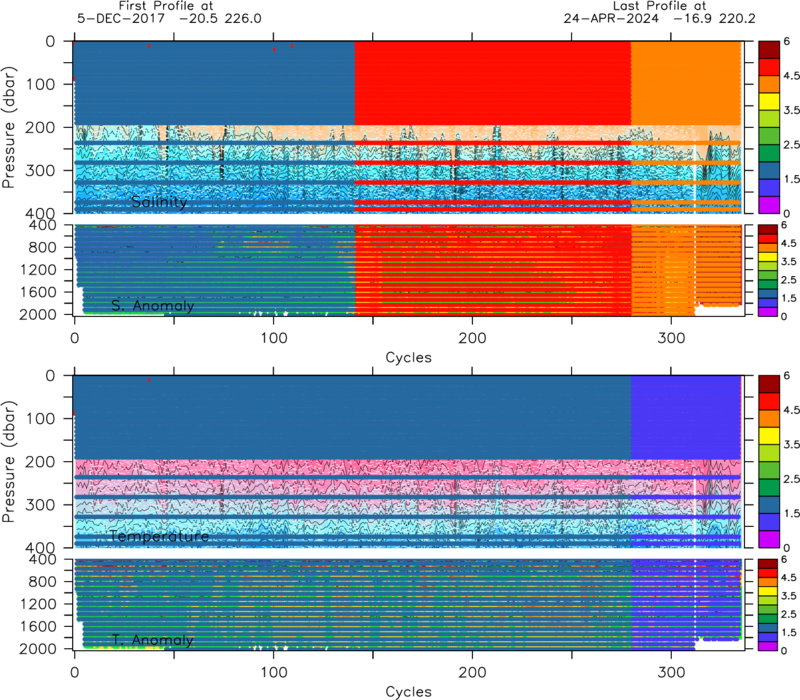
Display of the floats Delayed Mode Quality Control flags
as recently reported at the GDAC.
Plot may lag the GDAC by
up to 10 days.
Colored circles represent the 1 (blue) to 4
(red) Argo QC scale. The dots are overlain on a contour plot
of the profile data |
|
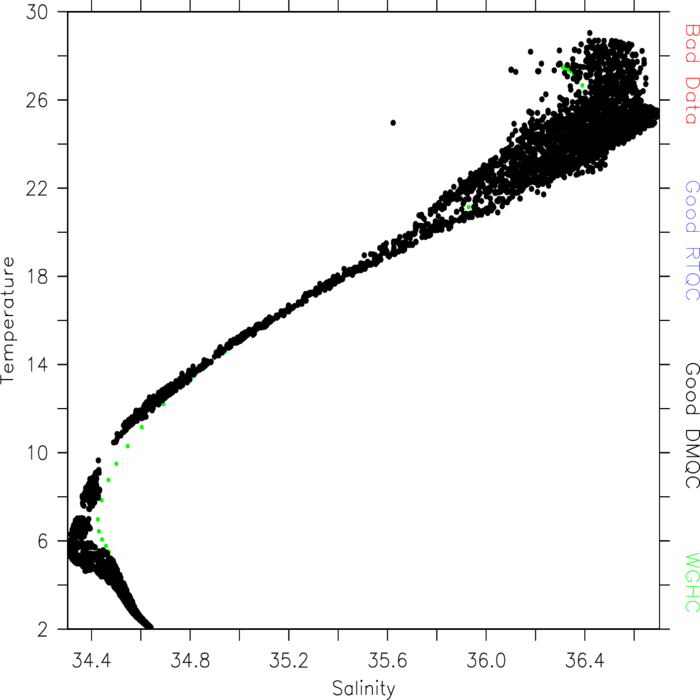
Temperature Salinity Plot of Quality Controlled Data
|
Temperature/Salinity diagram of Quality Controlled Argo
profile data.
The data is color coded by QC status (Delayed
Mode or Real-Time) and goodness [Argo flag 1 (good) or other
(bad)]. |
|
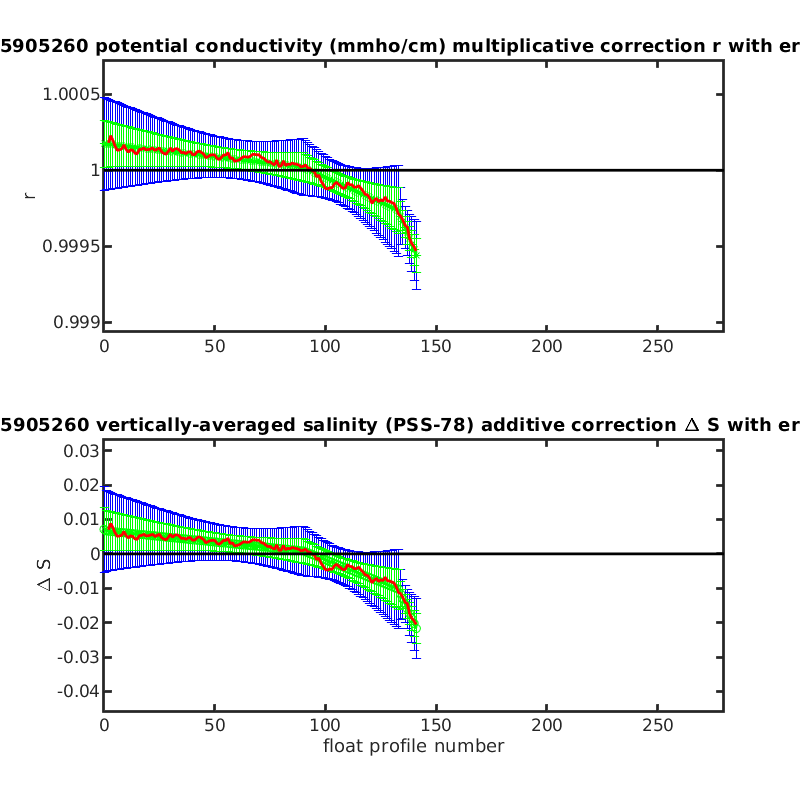
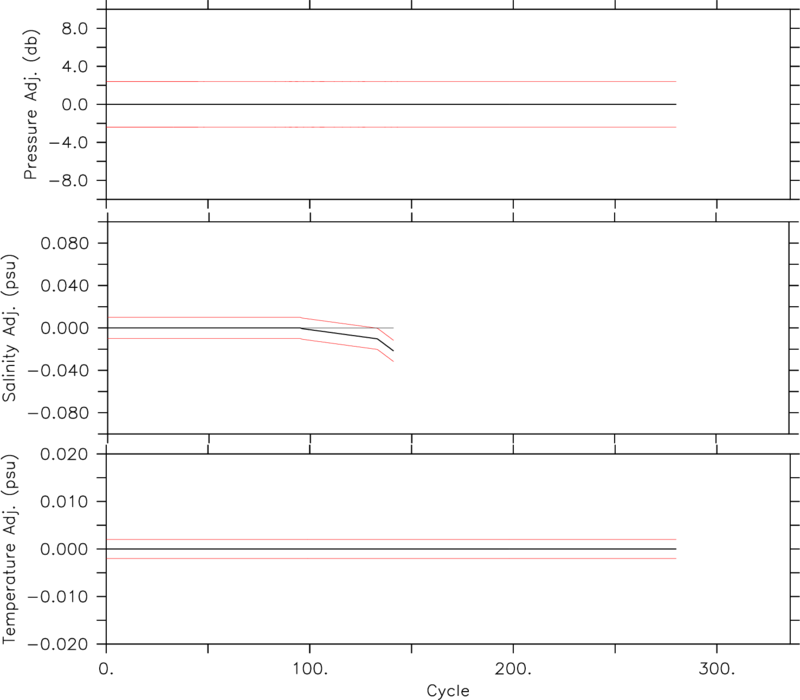
Currently Assigned Sensor Drift Corrections
|
These are the drift corrections found in the Delayed
Mode netcdf profile files at the GDAC. Error bars
are also shown.
If no lines are shown, then the data has
not yet passed through DMQC. |
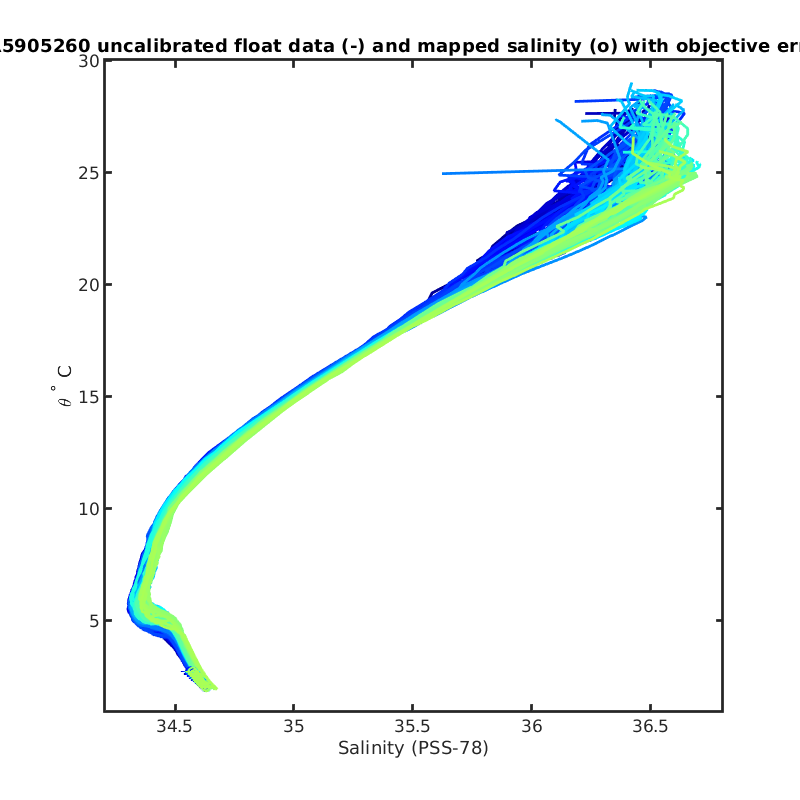
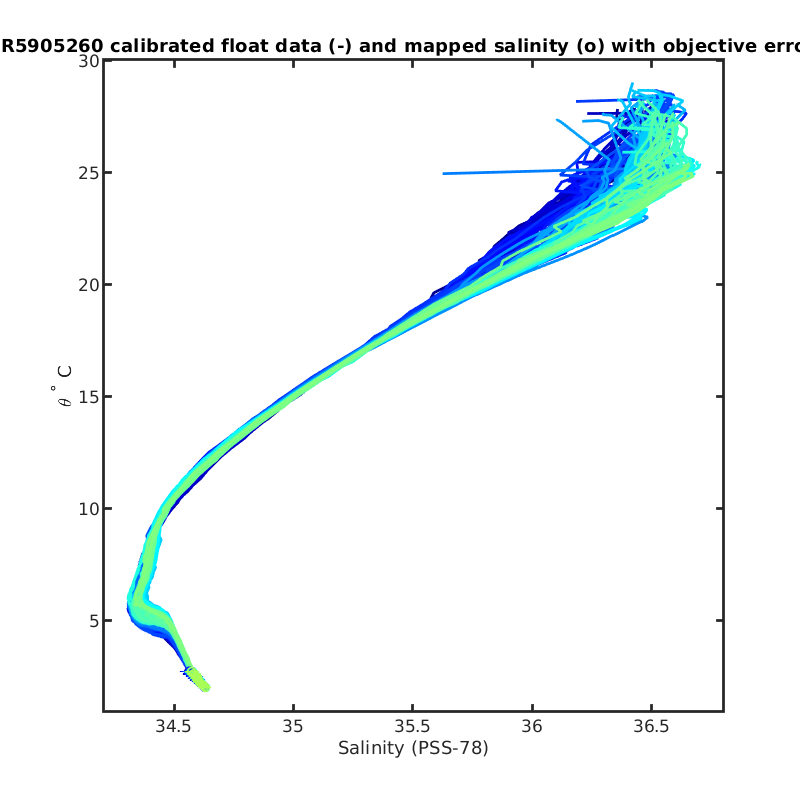
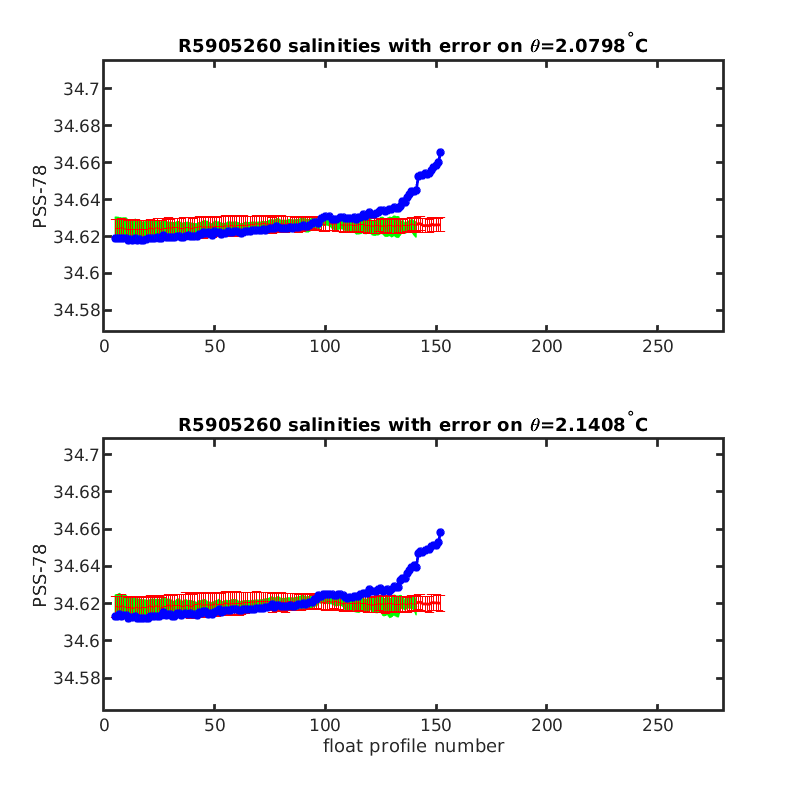
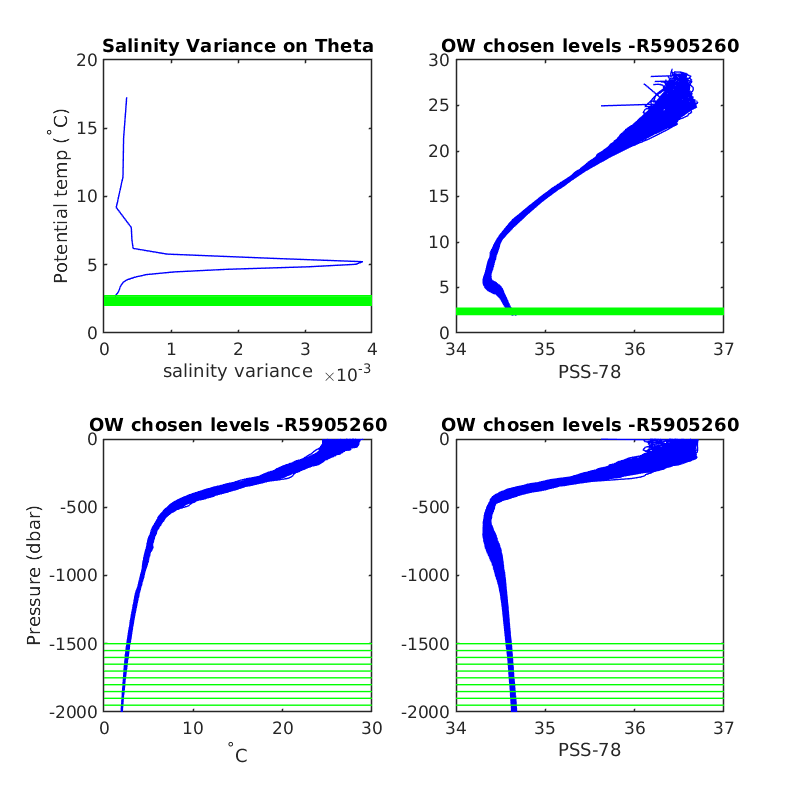
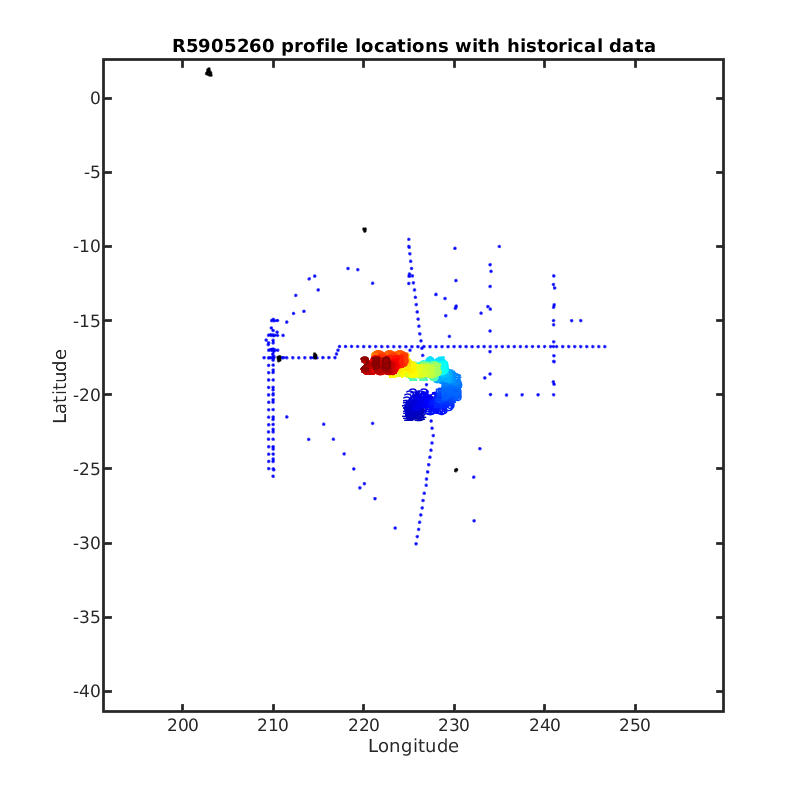
If present, the below figures are produced by the OWC
(Owens, Wong, Cabanes 2020) salinity calibration software.
This software is used throughout the Argo program to access the
presence of salinity drift. |
OW Argo Delayed-Mode Salinity Calibration Plots
|