
|
|
SIO Argo Site:
|
|

|
| Return to sio-argo.ucsd.edu | Return to home page |
| Return to Active Float Table | Return to the Table of active SIO floats |
| Return to Newly Surfaced Table | Return to the Table of newly surfaced SIO floats |
| Return to Float-Type Matrix | Return to Matrix of floats with similar ROM version |
| Float Diagnostics | Float Diagnostics returned each cycle to monitor float health and behavior |
| Access Data | Access Argo netCDF data at the GODAE ftp server |
| Access Aux Data | Access Argo netCDF AUX data at the GODAE ftp server |
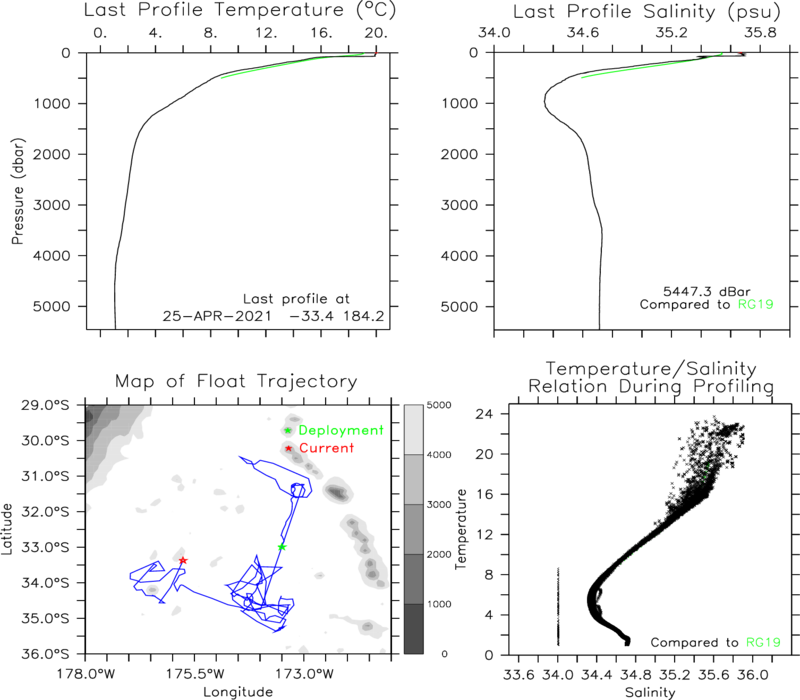
| Display of the latest Temperature and Salinity profile
returned by the float. The floats trajectory over its lifetime is shown in the lower left. No quality control is performed on this data. Background climatology (green line) is obtained from the Roemmich-Gilson Argo Climatology |
|
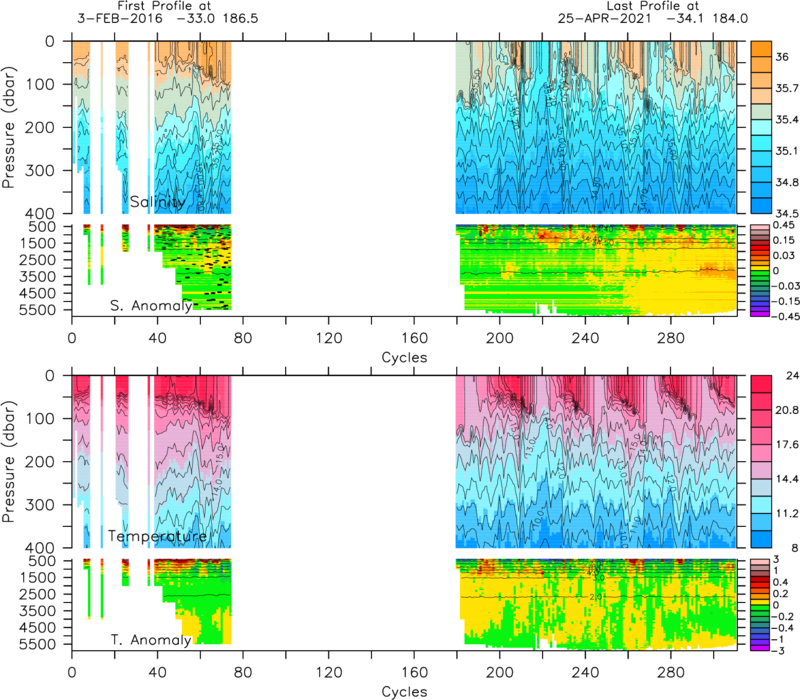
| Contour of the floats temperature (lower) and salinity
(upper) data. Deeper than 400 dbar, the anomaly, defined relative to the mean at that pressure, is displayed. No quality control is performed on this data |
|